

Pokemon Market Deep Dive Analysis Vintage & Modern
Posted by Wai Yin Bryan Tsai on
The Global Pokémon TCG Market
A comprehensive analysis of Japanese vintage (1996–2005) versus modern sets across languages, revealing systematic undervaluation and emerging market opportunities.
Key Finding
Japanese vintage cards show PSA 9 price ratios of 20:1+ versus English equivalents, despite comparable or superior scarcity profiles.
Market Driver
30th anniversary celebrations driving 15-25% vintage appreciation through sustained demand elevation.
Executive Summary
TL;DR: Japanese Vintage Systematically Undervalued
Japanese vintage Pokémon cards (1996–2005) are systematically undervalued relative to English equivalents, with price ratios of 20:1+ at PSA 9 grade despite comparable or superior scarcity. Modern sets show inverted patterns with Japanese 20–40% premiums. Sealed vintage boxes trade at 3–5× calculated EV due to scarcity premiums, while modern Japanese boxes offer near-parity EV opportunities. Simplified Chinese cards represent high-risk, high-reward emerging market exposure.
Market Scale
Source: Statista Market Analysis
Price Discovery
Source: PriceCharting Sales Data
Market Context & Production Scale
Global Production Trajectory
The magnitude of Pokémon TCG production provides essential context for understanding scarcity dynamics. Cumulative worldwide production reached approximately 75 billion cards across 90+ countries and regions as of March 2025, representing one of the most successful entertainment product launches in history.
Generational Production Scaling
Source: Elite Fourum Production Analysis
Early Production Milestones
Three Dominant Market Dynamics
30th Anniversary Effect
Officially initiated January 30, 2026, driving sustained 15–25% vintage appreciation and corrective adjustments in modern singles.
Grading Market Maturation
PSA, CGC, and Beckett proliferation creating standardized pricing infrastructure, with collectors becoming increasingly selective about grading economics.
Currency Exchange Impact
Yen weakness against USD creating favorable purchasing conditions for Japanese products, with 1.35× conversion factors plus 10–20% local premiums in Asian markets.
Language-Specific Market Structures
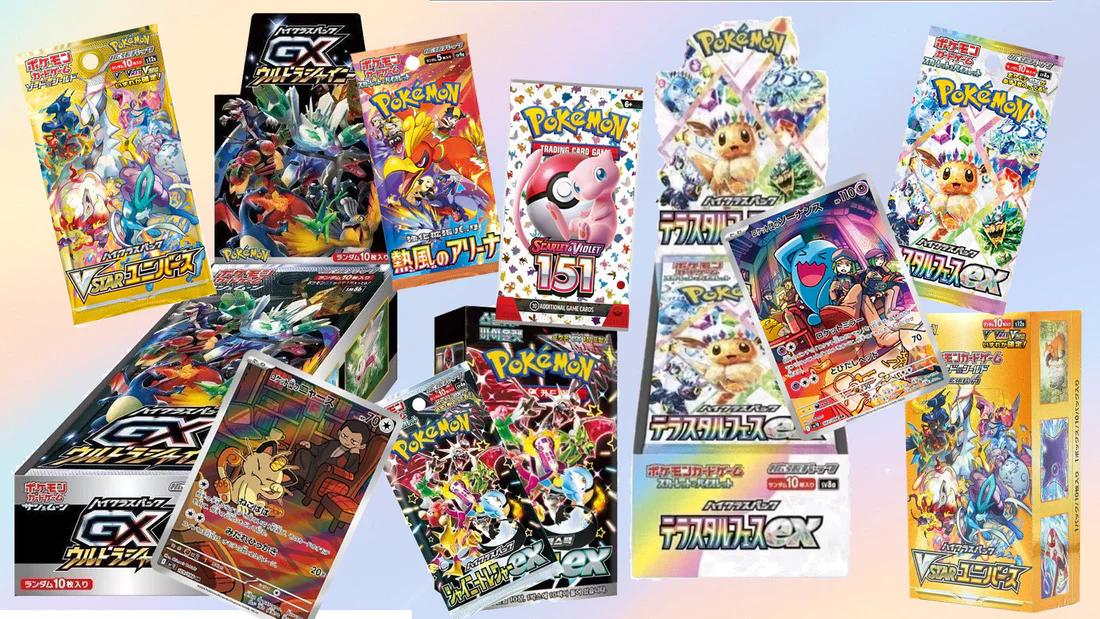
Japanese (Domestic Market)
Structural Advantages
- • Direct Pokémon Company management
- • Superior quality control & centering
- • Higher PSA 10 achievement rates
- • Estimated 1:6.25 print run ratio vs English
Market Characteristics
- • Lower secondary market liquidity
- • Reduced "flex" culture
- • Preservation over monetization preference
- • Gradual trickle into 2nd-hand market
"JP will trickle into the 2nd-Hand market slowly over time" - Market Participant Observation
Source: Elite Fourum Discussion
English (International Market)
Market Advantages
- • Largest global buyer pool
- • Highest resale liquidity
- • Narrower bid-ask spreads
- • Universal tournament legality
Cost Structure
- • 15–25% higher logistics costs
- • Lower PSA 10 achievement rates
- • Quality control variability
- • Nostalgia premium pricing
Western collectors who experienced the 1999–2000 boom now possess substantial disposable income, creating sustained demand for English-language products of their youth.
Source: Market Analysis
Traditional Chinese (Hong Kong/Taiwan)
Manufactured in Japan with "F" suffix identifiers, combining Japanese quality with regional distribution.
Simplified Chinese (Mainland China)
Unique security features and multi-expansion combinations create distinct market dynamics.
Print Run Analysis and Estimation
Documented Production Figures
Foundation Data
Critical Insight
By the time English-language products entered the market in 1999, Japanese domestic production had already established substantial card populations that would become scarce only through attrition and degradation over subsequent decades.
Estimation Methodologies
PSA Population Ratio Method
Compares graded card counts across languages using documented ratios as reference points. For Base Set Charizard, the established 1:6.25 Japanese-to-English print ratio enables extrapolation.
Shipment Data Reverse-Engineering
Applies documented total production figures to individual sets through proportional allocation based on relative set longevity and documented sales performance.
Community-Based Estimation
Incorporates multiple data sources including sealed box weights, pack opening statistics, and historical retail distribution patterns to produce plausible ranges.
First Edition vs Unlimited Dynamics
English Market Pattern
Japanese Market Anomaly
Japanese "No Rarity" Exception
Source: Sports Card Market Analysis
Graded Card Population Analysis
English 1st Edition Base Set Charizard
PSA 10 population grew from ~30 in 2009 to 120 by September 2019, with only 4 additional copies by 2023, demonstrating extreme scarcity.
Japanese Base Set Charizard
Estimates based on 1:6.25 print run ratio. Actual figures may differ due to lower Japanese grading submission rates and cultural preservation preferences.
PSA Population Comparison
| Card Variant | PSA Total | PSA 10 | PSA 10 Rate | Recent PSA Sale |
|---|---|---|---|---|
| English 1st Ed Charizard | ~853 | 124 | ~14.5% | $369K–$550K |
| Japanese Regular Charizard | 3,634 | ~521 | ~14.3% | $2.8K–$3.2K |
| Japanese "No Rarity" Charizard | 273 | 6 | ~2.2% | $57,877+ |
Sources: PSA Population Tracking, PriceCharting Data, Market Analysis
Grade Distribution Insights
Japanese Quality Advantage
- • Sharper text and more vibrant colors
- • Better centering reducing deductions
- • Higher PSA 10 rates by 5–15 percentage points
- • Cultural handling norms improving submission quality
English Condition-Scarcity
- • Lower PSA 10 rates create artificial scarcity
- • Supply chain handling reduces grade potential
- • PSA 10 premiums reflect condition difficulty
- • Production-scarcity vs condition-scarcity distinction
Price Ratio Analysis Across Languages
Vintage Card Price Ratios (1996–2005)
Key Insight
Price ratio compression from ungraded (1.5×) to PSA 9 (20×) demonstrates how grading amplifies language-based scarcity effects beyond what raw price comparison captures.
Modern Card Price Ratios (2020–2026)
Pattern Reversal
Modern sets show partially inverted relationships with Japanese cards commanding premiums, reflecting widened print quality advantages and "authenticity" perception in collector psychology.
Systematic Price Ratio Framework
| Grade Tier | JPN:ENG Ratio | Pattern | Primary Driver |
|---|---|---|---|
| Raw | 0.68:1 | Japanese discount | English liquidity + nostalgia premium |
| PSA 8 | 0.30–0.50:1 | Expanding English premium | Grade scarcity amplification begins |
| PSA 9 | 0.04–0.05:1 | Extreme English premium | PSA 10 proximity speculation |
| PSA 10 | Variable >1:1 | Japanese scarcity can dominate | Absolute population scarcity |
Dynamic Nature of Ratios
Vintage Market Factors
- • English nostalgia premium concentration
- • Japanese supply inelasticity
- • Grading cost economics
- • Liquidity preference asymmetry
Modern Market Factors
- • Print quality differential widening
- • "Authenticity" premium emergence
- • Tournament legality support
- • Cross-border arbitrage efficiency
Sealed Booster Box Economics
Sealed Box Price Structures
Vintage Premium
Modern EV Play
Expected Value Calculation
Grade Probability Distribution
English Base Set Charizard EV
EV-to-Price Ratio Analysis
| Box Category | Market Price | Est. EV | EV/Price Ratio | Investment Implication |
|---|---|---|---|---|
| Japanese Vintage Base Set | ~$110,000 | ~$25K–$40K | 0.23–0.36 | Pure scarcity play; negative EV break |
| English Vintage 1st Ed | >$400,000 | ~$150K–$200K | 0.38–0.50 | Trophy asset; institutional holding |
| Japanese Modern | £60–£80 | £120–£150 | 1.5–2.5 | Positive EV; systematic breaking viable |
| English Modern | £100–£130 | £100–£140 | 0.8–1.4 | Marginal EV; depends on grade outcomes |
Vintage Market Efficiency
Modern Market Inefficiency
Player Base, Collector Base, and Demand Drivers
Geographic Market Distribution
United States
Japan
China
Player-to-Collector Conversion
Conversion Pathway
English Market Advantage
Tournament legality creates player-driven demand with high price inelasticity, providing price floor support independent of speculative dynamics.
Japanese Market Characteristic
Collector preference for preservation over monetization reduces secondary market supply, creating more inelastic supply curves and price stability.
Cultural Factors in Collecting Behavior
Western "Flex" Culture
Example: Logan Paul's Pikachu Illustrator
Japanese Collecting Discretion
Market Behavior
"JP will trickle into the 2nd-Hand market slowly over time" - Japanese cards represent "a much better, more stable buy because they never got as much hype"
Influencer and Anniversary Effects
30th Anniversary Impact
- • January 2026 initiation
- • Sustained demand elevation
- • 15–25% vintage appreciation
- • Multi-channel demand generation
Streaming and Digital Influence
- • Pack-opening video demand
- • Collection showcase effects
- • Pokémon TCG Pocket crossover
- • COVID-19 market revival demonstration
Value Assessment: Undervalued and Overvalued Segments
Potentially Undervalued Categories
Japanese Unlimited Editions (1996–2005)
Anomalous pattern where Unlimited print runs sometimes smaller than First Edition. Standard scarcity-based valuation may produce incorrect rankings.
Pre-Skyridge Japanese Sets
Substantially lower PSA populations than English equivalents, yet price premiums remain modest compared to population ratios.
Traditional/Simplified Chinese Early Releases
Limited PSA population data and thin trading volumes create valuation uncertainty with Chinese market growth potential.
Japanese Promo Cards
Trophy cards, event exclusives, and campaign-limited releases with historically limited Western market participation.
Potentially Overvalued Categories
English Modern Chase Cards
Uncertain long-term print run data with substantial reprint risk. The Pokémon Company has demonstrated willingness to reprint popular sets.
Mid-tier Graded English Cards (PSA 7–8)
Abundant supply relative to collector demand for investment-grade holdings. Often represent failed grading attempts with higher grade expectations.
Sealed Modern Products
Concentrated bets on production policy decisions outside collector control. Ongoing reprint possibility can abruptly eliminate scarcity premium.
Speculative Investor Concentration
Heavy concentration in English vintage PSA 10 cards with established auction records creates amplified price movements and correlation with broader risk assets.
Market Anomalies and Arbitrage Opportunities
Japanese vs English Artwork Parity
Identical artwork across languages combined with Japanese quality advantages and lower prices for many vintage cards.
"No Rarity" vs 1st Edition Disconnect
"No Rarity" Charizard PSA population below 7.5% of regular Japanese Base Set with PSA 10 rate below 2%, yet price ratios don't reflect scarcity differential.
Chinese Market Inefficiencies
Information gaps, regulatory uncertainty, and thin trading volumes prevent efficient price discovery, with Traditional Chinese prices lagging Japanese signals.
Interactive Dashboard Components
Multi-Language Price Comparison Tool
Population Pyramid Visualization
Sealed Box EV Calculator
Box Selection
Grade Probabilities
EV Calculation
Primary Data Sources and Methodology
Official Sources
Community Research
Academic Research
Important Limitations and Caveats
Data Uncertainty
- • Incomplete official print run disclosure
- • Estimation models subject to ±30% uncertainty
- • Chinese market data gaps and volatility
- • Preconstructed product inclusion effects
Methodological Constraints
- • Grading population temporal bias
- • Differential submission rate effects
- • Submission cost economic thresholds
- • Multi-grader population fragmentation